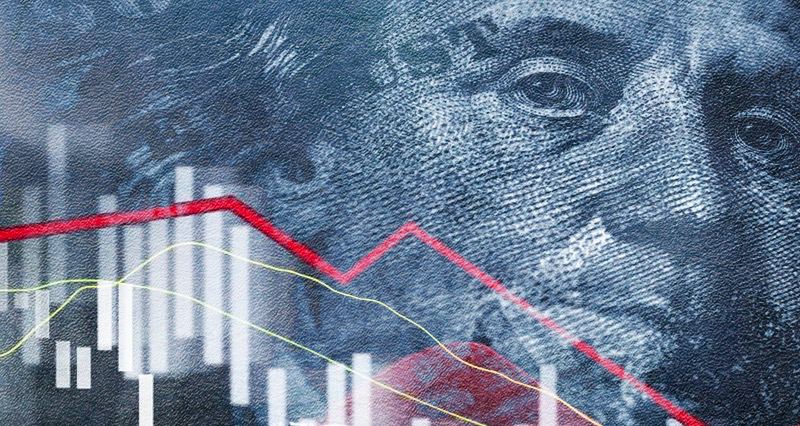
On functions, history, weakness, and reasons of the decline of the currency.
On functions, history, weakness, and reasons of the decline of the currency.
By Hakan Topkurulu
Today, the foundation of the world economic system is the Atlantic system headed by the USA. The other countries at the top of this system are Italy, Spain, the Netherlands, Belgium, and other western European countries led by Germany and France, as well as the United Kingdom and Japan, Canada and Australia (South Korea has also started to be considered among these countries). These countries represent the developed capitalist system in the world. The 7of them with the largest economies are called G-7 countries.
The general organizers of the system are the central banks of the system countries, in particular the IMF and the World Bank.
The main characteristics of these countries are that they transformed their economies into industrialised economies until the last quarter of the 19th century. In these countries, agricultural production and the system of land ownership, which was the feudal mode of production and constituted almost all of the production, have been dissolved.
This infrastructural development also shaped the superstructure of this foundation. The Enlightenment or the Renaissance, as it is generally called, brought with it the cultural environment that shaped people’s relations, ways of thinking, organisation, etc. in the process of transition to capitalism.
As capital has exceeded the domestic market volume, these advanced capitalist countries have started to export capital and trade goods to the peripheral countries. Countries other than industrialized countries are still governed by an economic system based on agriculture and land ownership. In some of these countries, industrialization has started, at least in a small scale. However, the increase in production in developed capitalist countries and the cheap and abundant goods created by the increase in production led to the result that these weak industries were excluded from protection and became semi-colonial countries.
In the 19th century, with the above-mentioned phenomenon, commercial relations began to develop between industrialized countries and states that had failed to achieve democratic revolution politically and industrialization and independence from agriculture economically. Trade has also started to develop between all countries.
Money was initially made up of gold and silver. As a result of the development and spread of trade, since these precious metals were not available in sufficient quantities to maintain commercial relations, the amount of money was tried to be increased by mixing less valuable metals (adulteration) into the money produced with precious metals. The inadequacy of this solution necessitated the use of more abundant metals such as copper, nickel and paper money in trade.
The emergence of metals and paper other than precious metals revealed the need to value the value of money other than precious metals. This requirement was met by ‘fiat money’.
What is fiat money? It is money whose value is determined by the state that produces and prints it. In short, all the money we use in trade today is ‘fiat money’.
Now, instead of gold or silver coins, the value of which everyone agrees on, money with almost zero production cost has come into play. (Nowadays, those coins with material existence are gradually disappearing and are replaced by digital money).
While each country’s own national currencies can be used in domestic trade, in international trade, currencies whose value is accepted by everyone, and which have the ability to be exchanged must be valid. The currencies of countries with very weak and unstable economies are not suitable for international trade. In addition, a state that wishes to use its currency in international trade must have a significant volume of foreign trade. Fiat money has brought along such an obligation.
This is one of the most important reasons why the currencies of Great Britain in the past and the USA today are the dominant currencies in international trade.
Another important factor for fiat money to become the dominant currency in international trade is that the production and commercial power of the state that produces the currency. Additionally, the state’s armed power must also be at a sufficient level to protect this very critical privilege.
All countries need access to this money to conduct international trade. This country, which has the privilege of using its money in international trade, has the chance to access the goods it wants from all over the world at a value close to zero cost with only a simple money printing activity.
But this great privilege also comes at a natural cost: an armed force strong enough to cope with the whole world… For this reason, the USA today has a navy in all the seas of the world. It also maintains military bases in the countries it threatens. The USA is the main country in the world that allocates the largest share of its budget to military expenditure.
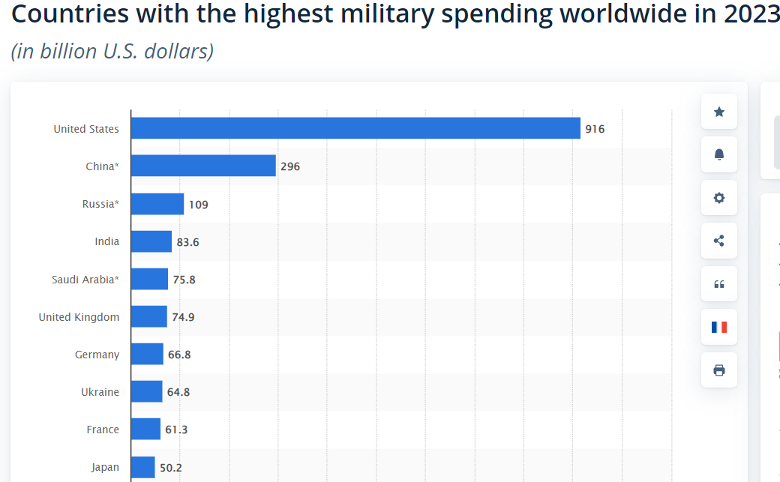
The table above lists the 10 countries with the highest military expenditure in 2023. As can be seen from the table, the US military expenditure is more than twice that of the People’s Republic of China, which ranks second. (Source: Statista)
What functions does the dollar has today?
Today, the dollar fulfills 3 important functions in the world:
1) Means of Payment: It is used as a means of payment in international trade.
2) Reserve Currency: The world’s central banks hold the US dollar in their reserves to be used in case of urgent need.
3) Unit of Measure: Almost all of the goods subject to international trade are priced in dollars.
The dollar, which is the currency of the United States of America, has gained the necessary environment to fulfill these three functions with the support of the great production power of the USA after the Second World War and the armed power it has.
The USA still maintains its position as the world’s largest economy and armed power.
| TOP 10 COUNTRIES ACCORDING TO 2023 GDP | |
| Country | GDP |
| USA | 26,954 |
| CHINA | 17,786 |
| GERMANY | 4,43 |
| JAPAN | 4,231 |
| INDIA | 3,73 |
| UNITED KINGDOM | 3,332 |
| FRANCE | 3,052 |
| ITALY | 2,19 |
| BRAZIL | 2,132 |
| CANADA | 2,122 |
As can be seen from the table above, the US remains the world’s largest economy in terms of nominal GDP. (Source: 360tftrade)
Weakness and decline in the economic and political power of the USA
There is a law of nature that everyone accepts in common. Everything is born, grows and dies. Although this is generally accepted by everyone, the assumption that the status quo will change cannot be internalized and accepted by some.
This is true for the USA and Europe today. The public thinks that the USA and Europe as ‘so powerful and experienced that they will find a way out of the difficulties they find themselves in’.
However, the real situation is different from what they think. Yes, they may represent a great economy and armed power today. However, social events cannot be understood by taking a photograph of today’s situation. No matter how real a frame from today is, it is impossible to interpret it because it does not show the development.
In order to understand the reality in which the USA and Europe find themselves, it is necessary to look at historical development and take a movie, not a photograph. It is necessary to interpret and understand the USA and Europe within historical development. The Ottoman Empire, Rome and all other great empires were living their greatest and most glorious days when they began to collapse. If we had taken the photograph of that day, we would not have been able to understand that neither the Ottoman Empire, nor Rome, nor the other great empires had begun to decline. What we say today about the USA and other developed capitalist countries, we would have said about them on the day when that photograph was taken.
Let us now begin to analyze the economic situation of the countries of the Atlantic system, mainly the USA, in the historical process.
Historical development of the US economy
There are many economic indicators. However, some of them are more critical and clearly describe the real situation. In this section, we will comparatively analyze the most important of these economic indicators and the ones that will end the economic hegemony of the USA in the historical process.
As we have explained in the introduction above, the most important factor on which the economies of the USA and all the other countries of the Atlantic system are based is the validity of their currencies in world trade. If their currencies are not recognized tomorrow as they are today, all the prosperity and wealth of the Atlantic countries will be destroyed. This point will be the most critical and final point to be reached by all economic indicators that we will explain hereafter.
All economic indicators will shape the future according to the goal of ensuring the continuation of the prestige of the dollar or other Atlantic country currencies in the mechanism we have described as IMPUTABLE-FIAT MONEY.
1.) When we examine two consecutive tables in industrial production, which is one of the very important and critical data, the driving force and foundation of the economy, we see that the USA ranked first in world industrial production with 28.7% in 1970. When we rank the top 10 countries in 2024, we see that China, which ranked 8th in 1970, is by far ahead of the USA.
2.) In 2009, China surpassed the USA in industrial production and ranked first (Source: Fee):
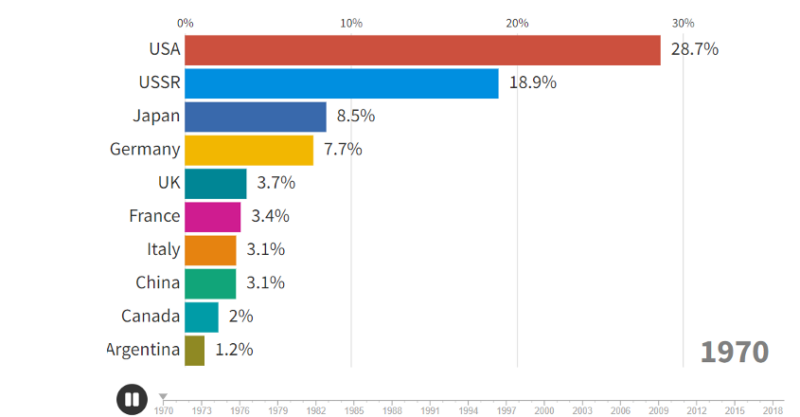
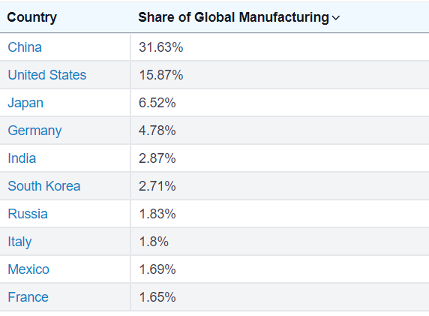
(Source: World Population review)
It is an economic reality that China has risen to the first place in industrial production, which forms the basis of economic power, and that the USA has permanently fallen behind. Industry here includes not only traditional industrial products but also artificial intelligence, high technology and space technology products.
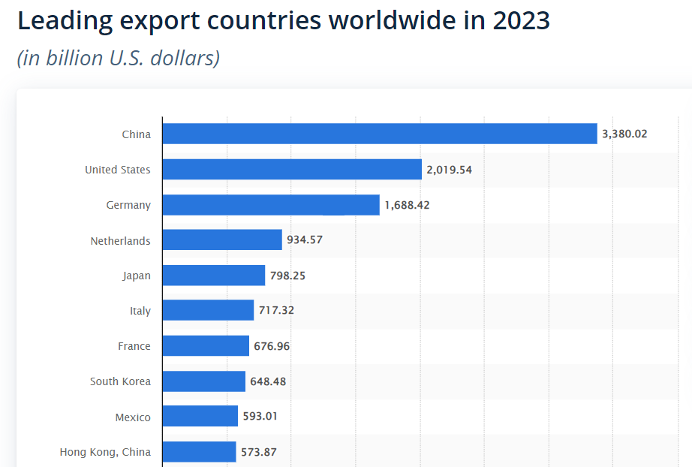
3) In the world export ranking, which is one of the most important economic indicators, China surpassed the USA in 2009.
The fact that China still ranks first in the world export ranking for 2023 despite the US sanctions, as shown in the table below, is a clear indication that the economic power of the USA has decreased compared to previous years (Source: Statista).
Why cannot the US escape from the current crisis?
Under conditions of unequal development, the imperialist system continued to maintain leadership by changing hands within itself. Most recently the leadership passed from the United Kingdom to the United States. For a while, until the early 1980s, the Soviet Union threatened this leadership for a while. In 1991, when the Soviet Union collapsed, the Atlantic imperialist system became the sole dominant system, and the United States became the top state of this system. In the 1990s, a new era began in the People’s Republic of China. With its policies of opening to the outside world, China embarked on a massive investment drive. As can be seen in the tables above, in 2009 China surpassed the USA in industrial production and export figures, which are among the most important economic indicators.
The most important consequence of the People’s Republic of China’s surpassing the USA is that a country outside the Atlantic system has broken this imperialist grip and moved its economic power outside.
The transfer of economic power does not mean anything by itself. However, the power of production also creates its own rebellion, pole and option in time. As a matter of fact, BRIC (BRICS 2 years later) was established under the leadership of Russia, coincidentally in 2009. It was also in 2009 that China overtook the USA as the world’s largest country in terms of exports and industrial production. 2 years later, when South Africa became a member of the group, its name became today’s BRICS.
In the years when BRICS was established, it emerged as a new formation, a pole against the economic hegemony of the USA, together with the broken economic hegemony of the USA by China.
Today, BRICS continues its way to becoming an institution that is gradually starting to take its own decisions. Firstly, it established a development bank called NDB (New Development Bank). This was a very important step. This step was taken quietly. This was the first institutional structure of BRICS.
Since this article was written in September, it is not yet clear what decisions will be taken at the 16th BRICS Russia-Kazan meeting to be held in October. However, after Ethiopia, Iran, Egypt and the United Arab Emirates joined as new members at the 15th meeting held in South Africa last year, the rumor that 34 countries, including Türkiye, have applied for membership this year will lead to very striking results.
Especially Türkiye’s membership application and its acceptance is a revolutionary event in terms of a NATO member country breaking the NATO chain and becoming a member of BRICS.
Yes, the fact that the People’s Republic of China surpassed the United States in 2009 has weakened the gravitational pull of the Atlantic system. On the other hand, BRICS, which has become a new pole, has started to increase its power of attraction, slowly at first, but rapidly since last year.
Economic weakening has been accompanied by political weakening. This is the evolution from a unipolar world to a multipolar world.
Indicators of decline within the US
In fact, the US would have preferred to overcome the economic crisis it experienced in 2008 with the principle of ‘Let the sink sink, it is necessary to move on with new and younger sprouts’. Such a preference would have brought with it the chance for the USA to replace the old and worn-out ones with new ones. However, the new ones were no longer coming from within the Atlantic system. Chinese companies and banks were replacing the outgoing ones. Therefore, even though it was worn out, it had to revive the old and continue. For this, it decided to continue the road by printing enormous amounts of money and supporting the old ones with this money.
In the table below, we see the graph showing the amount of money printed by the US to implement this decision in the years following 2008 (Source: FRED):
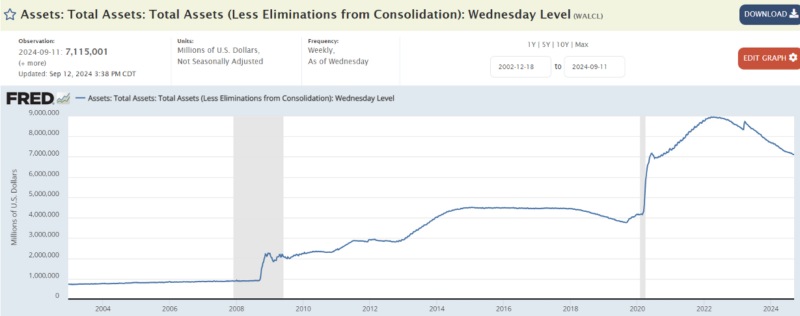
When we look at the table, the amount of money released by the US Central Bank FED until 2008 is 900 billion dollars. This amount released to the market by the FED reaches 9 trillion dollars in the crisis year of 2008 and the following years until 2022. To implement its new policy, the US put 10 times more money into the markets than usual.
The circulation of this amount of money in the markets involves great risks. When the US central bank released this money to the markets, it naturally planned that this money would not go to consumption. This printed money will not be distributed to the public, so as long as this money does not go out of control in the market, the risk of creating hyperinflation was not non-existent, but not very high.
In 2020, the pandemic and the financial aid to millions of people who could not return to work and the release of money to the markets for covid-19 caused this money to create a risk of hyperinflation.
The FED realized that the money it released to the market, which was in the nature of aid, started to trigger inflation, and as of April 2022, it raised interest rates and started to collect the money it released to the market.
The interest rate applied by the FED to the money it had previously given to the markets was ‘0’. Therefore, those who used these coins did not see any harm in keeping these coins in their own accounts since they had no cost.
As interest rates started to rise, the banks that had been holding these previously printed monies because they had no cost, started to deposit these monies back into the FED accounts through reverse repo to get rid of the interest burden.
In the table below, we see the money returned to the FED accounts, which is the unused money in the banks, around 2 trillion dollars (Source: FRED):
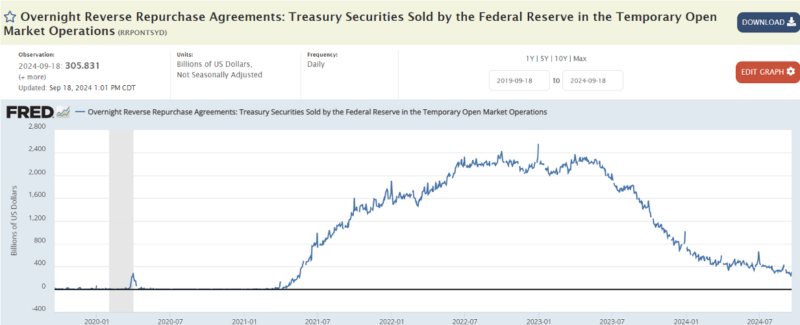
As can be seen from the table, this money has been increasing since 2021, when interest rates started to increase. In the previous table, this amount of money started to decrease with the FED’s operation to eliminate the excess money released to the market, which is called ‘burning money’ as of April 2022. This amount of money, also called ‘parked money’, was $ 305 billion as of 18 September 2024. And it is gradually decreasing.
As can be seen, there is a serious decrease in the amount of money returning to the FED accounts without paying interest.
What does this mean? This should be interpreted as follows: The US has started to collect back the abundant amount of money that it has released to the market in order to pull back inflation. The market, on the other hand, avoided the interest cost by depositing the part of this abundant money that it could not use back into the Central Bank accounts. The FED, on the other hand, absorbed this back by reducing the money in the market by 2 trillion dollars. With a generalization, the money absorbed so far was money that was not used anyway.
But now we will have to look elsewhere. Is the US comfortable when this money is sucked out of the markets? What will happen if the money that is actually in the markets is withdrawn when the useless part is over?
The table below shows the amount of US public debt. The latest figure in this table is as of 1 April 2024. The FED has not yet updated its debt as of September. In the table, the latest debt is seen as 34 trillion dollars. We know that this debt reached 35 trillion dollars in September (Source: FRED):
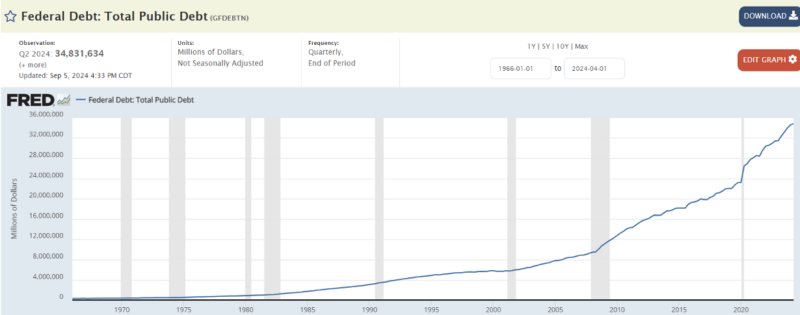
If we pay attention to the table, the US public debt, which started in the 1970s after the oil producer countries raised oil prices, gained momentum with the 2008 crisis. After the 2020 pandemic, the increase in debt continued to accelerate significantly.
To better understand the increasing public debt of the US and to see the danger, let’s see the ratio of public debt to GDP.
In the table below, we see the ratio of the US public debt to GDP over the years (Source: FRED):
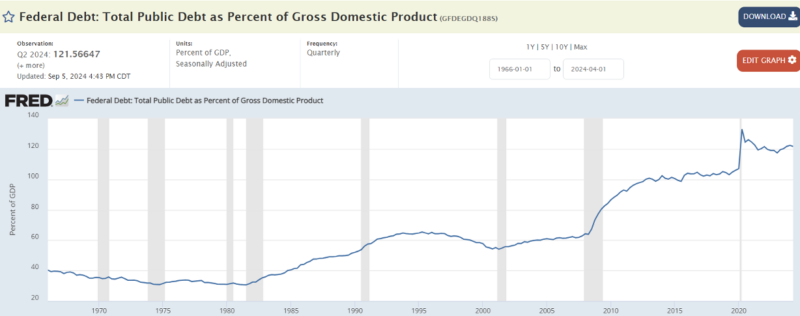
In this table, the deadlock that the US is facing becomes even clearer. Namely, in the previous table, we have seen that the upward acceleration in the amount of debt started to increase after the crisis in 2008. This increase also shows that the ratio of debt to GDP has also increased since 2008. The debt-to-GDP ratio has exceeded 100 per cent since 2015. In other words, what the US produces each year is no longer enough to cover the debt it has acquired. The latest debt-to-GDP ratio is 122 per cent.
The reason for the increase in the debt is the insufficiency of the tax and other budget revenues collected by the US to meet its budget expenditures.
The US debt has reached unsustainable levels. Of course, since the currency of the US debt is the currency that the FED, the US’s own central bank, can print easily, gratuitously and without question, it is natural that there is a certain degree of comfort. However, it is seen from the measures that the FED is trying to take that this comfort is not very sustainable.
As a result, what we need to understand here is that while the FED clears the money from the markets, the US Treasury needs to cover this deficit by borrowing instead of this money collected from the markets.
Finally, let us compare the public debt burden between G-7 countries and Türkiye. The table gives us the ratio of public debt to GDP. When analyzed comparatively, we see that it is no longer possible for the countries of the Atlantic system to cover their budget expenditures with the taxes they collect. (Source: OECD)
The ratio of public debt to GDP of Japan, which has the highest debt, is 240 per cent. Compared to G-7 countries, Türkiye has the lowest public debt/GDP ratio with 30 per cent.
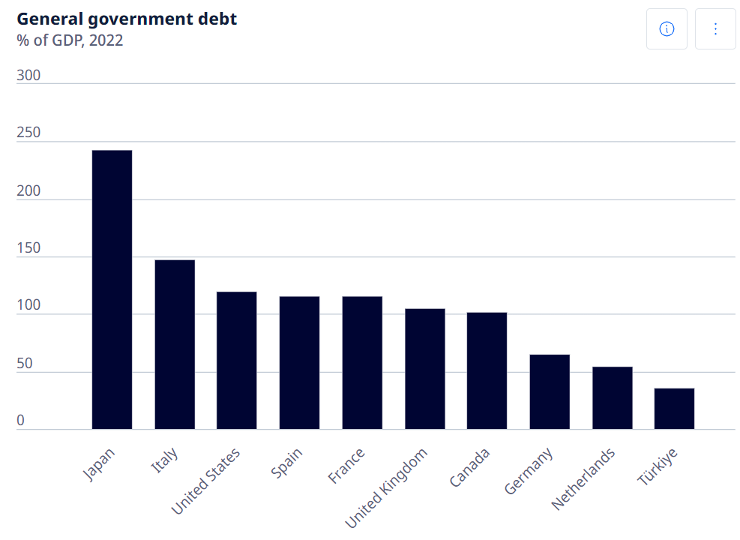
Let us now look at where the G-7 countries, especially their leader, the USA, got this public debt from.
Foreign sources that the US borrows from
We can all easily call gold the most reliable savings tool in the world. Gold has already been used as the first medium of exchange. It is also the first money and still the most reliable savings instrument to this day.
If you pay attention, I said ‘savings instrument’ for gold because gold is not an instrument that brings a return like interest. I do not count the exchange rate increase in Türkiye as income. That increase actually only protects us from inflation. The most reliable investment instrument after gold is unquestionably US government bonds. Despite some hesitations, US government bonds are still the most reliable investment instrument.
Now let’s look at where the U.S. obtained this debt, that is, to whom it sold these bonds. Here, I will look at the other states that bought US bonds. The movements here will give us clues as to where the US public debt is heading.
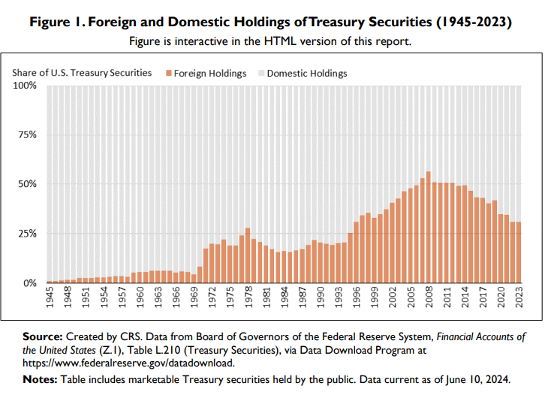
The table below shows the share of foreigners in the government bonds issued by the US between 1945 and 2023.
The table shows that the share of foreign governments in total US bonds has been increasing from 1945 to 2008. Foreign governments think that they are investing in a safe and at the same time profitable instrument by purchasing US bonds in their reserves.
In 2008, the share of US bonds purchased by other states in total US bonds reached the highest level ever. This level is around 55 per cent. However, with the 2008 crisis, the total foreign share in US bonds started to decline. Finally, in the table, the share of foreigners in US bonds in 2023 is around 30 per cent.
In this table, we understand that other states are gradually removing US bonds from their reserves. This trend shows that the world’s confidence in the US economy is decreasing.
In the table below, we see the amount of bonds held by the countries investing in US government bonds by months in 2024:

The table shows that the Atlantic countries are the dominant buyers of US bonds. Although the People’s Republic of China is in second place, the amount of US bonds it holds is decreasing significantly. The United Kingdom, Luxembourg, the Cayman Islands, one of the tax haven island countries in the Caribbean, Canada, Belgium and France are significantly increasing their holdings of US bonds. (Source: US Department of Treasury)
What we can see from this table is that the countries that lend to the US are Atlantic countries and tax haven countries that are in the same camp with the US, rather than all countries of the world.
Reserve structure in Central Banks of world countries
Reserves are the money, bonds or precious metals that central banks hold in their accounts or vaults in order to meet the urgent cash needs of their countries or to ensure that the economy remains balanced and stable.
Central banks make sure that the currencies they hold in their reserves are valid and stable currencies all over the world. They also pay attention to the fact that the government bonds they hold have stable and reliable economies rather than the income to be obtained. As for precious metals, they generally prefer gold, which is easily used as cash all over the world.
It is noteworthy that central banks want the assets they hold for the emergencies of their countries to be both globally valid and reliable.
For years, not only at gunpoint but also in times of economic necessity, central banks have made sure that their reserves include the dollar and US government bonds. Gold, on the other hand, although not inferior to the dollar in terms of reputation, did not take a large place in the reserves of central banks for a long time due to the difficulty of transfer.
However, as explained throughout this article, changes in reserve structures started to occur especially in the years following the 2008 crisis.
We will now examine the developments that constitute central bank reserves in two subcategories.
1) Changes in the Share of the US Dollar in Central Banks’ Reserves
The table below shows the IMF data and the change in the share of the dollar held in the reserves of the world’s central banks (Source: IMF):

As can be seen from the table, the share of dollars held in the accounts of central banks in the total has been decreasing over the years. Although its share in the total is still above 55 per cent, the share of the dollar continues to decline.
Besides being the most liquid value and being easy to use, the reliability of money is also very important. From this table, we can see that confidence in the dollar is eroding.
So, what replaces the declining dollar in the reserves of central banks? Another currency or government bonds or precious metals?
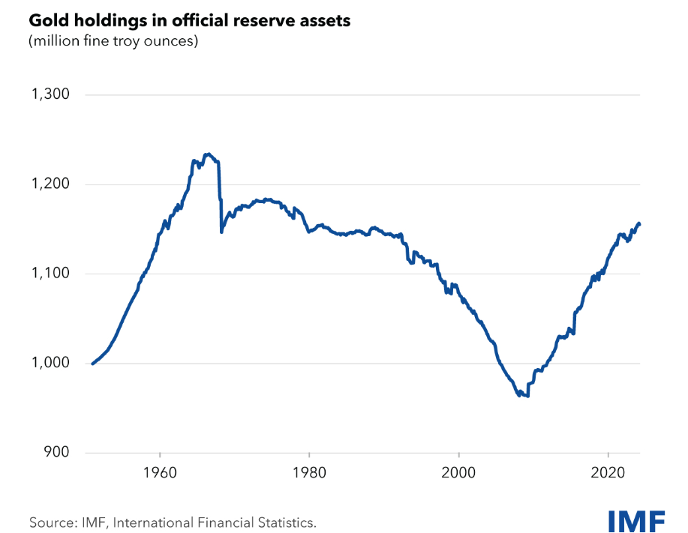
2. Changes in the share of gold in Central Banks’ reserves
Gold started to increase in the reserves of central banks especially after the 2008 crisis. We can easily see this development in the table below. (Source: IMF)
We can attribute the increase in the amount of gold in central banks’ reserves to two reasons:
1) The first of these reasons is that the dollar, sterling, euro, etc., which are used as reserve currencies in the world, were released in very large quantities in the years following the 2008 crisis. This unusually large amount of money naturally shook the confidence in the dollar and other reserve currencies and people started to reduce these currencies from their accounts.
2) The second reason is that the development of BRICS has created the conditions for the development of a new payment instrument or method on a world scale. When these emerging conditions were combined with the policy of ‘de-dollarization’, that is, the policy of excluding the dollar, central banks began to prefer to have gold in their reserves, which is always accepted as a common currency and can be used as a means of payment.
Valid Currencies in World Trade
As we know, one of the most important functions of the currencies called world reserve currencies is that they mediate international trade.
The table below shows the shares of the currencies used in world international trade in total trade and the change in these shares over the years (Source: IMF):
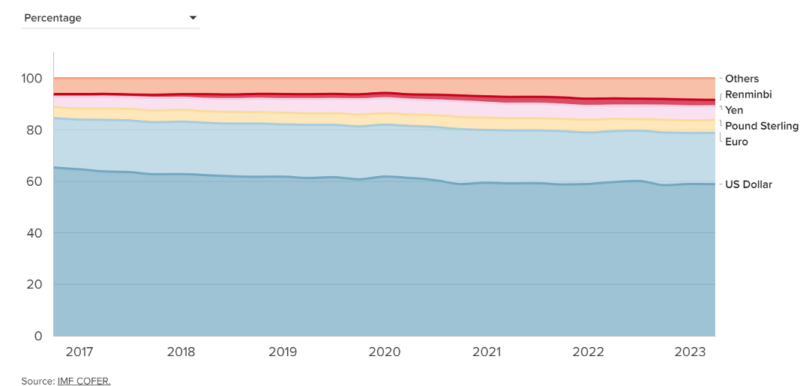
As can be seen from the table, the shares of currencies used in international trade have not changed significantly over the years.
Only the share of Renminbi (Yuan), the currency of the People’s Republic of China, has grown slightly over the years. While the share of the US dollar is just over 60 per cent, it is decreasing slightly. The euro, pound sterling, yen and other currencies have not changed much either.
The use of national currencies in international trade is increasing. Yes, as the sanctions imposed by the US on countries such as Russia, Iran, Syria, Venezuela, etc., which have started to resist the US system increase, the use of national currencies, especially in these countries, is increasing. However, this use does not take a very significant share in world trade. Although many countries, including Türkiye, try to apply this method to get rid of the hegemony of the dollar, it is not so easy to apply this method both technically and practically.
Conclusion
In conclusion, we can easily say the following: Considering both the developments in the US domestic economic dynamics and the developments in international relations, the share of the countries of the Atlantic system in the world economy has tended to shrink.
We can easily say that there is a mutual interaction here. The imperialist-capitalist system used to be able to control the governments through wars and coups d’états and leave the leadership of the system to another developed capitalist country. Now we see that they have lost this ability. All countries, especially the People’s Republic of China, which were previously integrated around the Atlantic system in the category of developing countries, have gradually begun to break away from the Atlantic system. These breaks weaken the center of the Atlantic system. We can see this in the sanctioning power of other developed capitalist countries, especially the USA. We can see this in the covert trade of countries such as Germany, Italy and France with Russia despite the US sanctions pressure. Even the countries of the Atlantic system do not comply with the sanctions imposed by themselves.
The countries of the Atlantic system, especially the USA, are facing serious structural problems economically. It is possible to easily reach this conclusion from the issues analyzed in the whole article. The countries of Asia, Africa and South America, which we can also call the 3rd World Countries, which are settled around both their own internal dynamics and the Atlantic system. Among these, we can also count Eastern European countries such as Hungary, Slovakia and Serbia, which are within the Atlantic system and close to it. They are moving away from the system.
Especially the development of BRICS has given a serious impetus to this process of disengagement. The application of a NATO member country like Türkiye for BRICS membership gives the impression that this momentum will increase significantly.
The statement made by Jamie Dimon, CEO of the largest US bank JP Morgan, clearly shows that the concerns of the other side (the Atlantic side) about the growth of BRICS are now being expressed.
The fearful dream of the USA is that the use of the dollar in both savings and international trade will end or decrease significantly.
The reason is that the US economy is based not on production, but on the difference between the nominal value of the dollar and the cost of its printing, which we call seigniorage value, entering the US economy. For the time being, the USA provides itself with great prosperity from the enormous amount of money it prints.
The article explains:
– The countries that lend to the USA are mainly countries in the Atlantic system that are already experiencing the same problems within themselves.
– The amount of dollars held as reserve currency is shrinking.
– Although it seems that the money released to the market is being recovered, it is actually being borrowed at very large rates, especially due to budget deficits.
We see that the confidence in the dollar has been mostly eroded. The erosion of confidence in the dollar strengthens the tendency to escape from the dollar. The emergence of an alternative means of payment will bring about the end of the dollar. However, developments indicate that the escape from the dollar may start before such a payment instrument emerges. This will result in the collapse of the entire Atlantic system, especially the US.
Today, BRICS is developing as an institution that will organize the future of the whole world.








Leave a Reply